

A distribution network can look efficient on paper and still falter as a complete logistics system. Logistics analysis and design connects order, inventory, cost and goods-flow data with operational realities to shape a network that supports business strategy and customer requirements.
That broader view matters. Facility locations, transportation choices and inventory decisions affect one another. People, skills, information and financial flows also influence performance. Reviewing each decision in isolation can hide pressures that emerge across the network.
This article explains how a distribution network study assesses current operations, identifies the number and location of hubs, and evaluates transportation, inventory and warehouse options. You’ll also learn how system-level analysis supports operational optimization and what information helps develop a practical design for your organization.
Key Takeaways
- Use order, inventory, product and distribution data to identify where your network supports demand and where its design may need adjustment.
- Assess transportation, inventory and facility decisions together, since changing one part of the network can affect the performance of others.
- Start complex system planning with the business environment, then define operating concepts and technical requirements that fit the organization.
- Evaluate logistics performance by considering service levels alongside the operational factors that shape network performance, not as separate measures.
- Prepare clear shipment, operating and service information so a logistics professional can assess the network and shape practical next steps.
Distribution network design
A distribution network study begins with evidence from actual operations. Analysts combine inbound and outbound order data, inventory levels, distribution volumes, product master data and shipment records. These inputs show where goods originate, where demand occurs and how products move between locations. For a Canadian network, origins and destinations can reveal whether current routes serve customers and operational requirements effectively. Product data also helps distinguish the handling needs of different goods.
Data alone cannot explain every constraint. Interviews with key stakeholders add context about current challenges, service expectations and corporate strategy. For example, a sales team may identify customer demand for shorter lead times, while operations staff describe transfer delays. Comparing these accounts with order and inventory patterns helps distinguish a recurring network issue from an isolated problem. Stakeholder input can also surface requirements missing from shipment records.
With the operating picture established, analysts assess goods flow and network efficiency, then test alternatives for how shipments move through the network. These choices must align with demand and lead-time requirements, rather than treating each route independently. A proposed change, for instance, may shorten one route but add a transfer point. Analysts assess how that change affects the movement of goods across the network.
- Map demand: group order destinations and volumes to identify where customers are concentrated.
- Trace movement: follow inbound and outbound shipments through current routes and transfer points.
- Compare scenarios: assess network flows against service requirements.
- Review constraints: incorporate stakeholder knowledge about current challenges and strategic priorities.
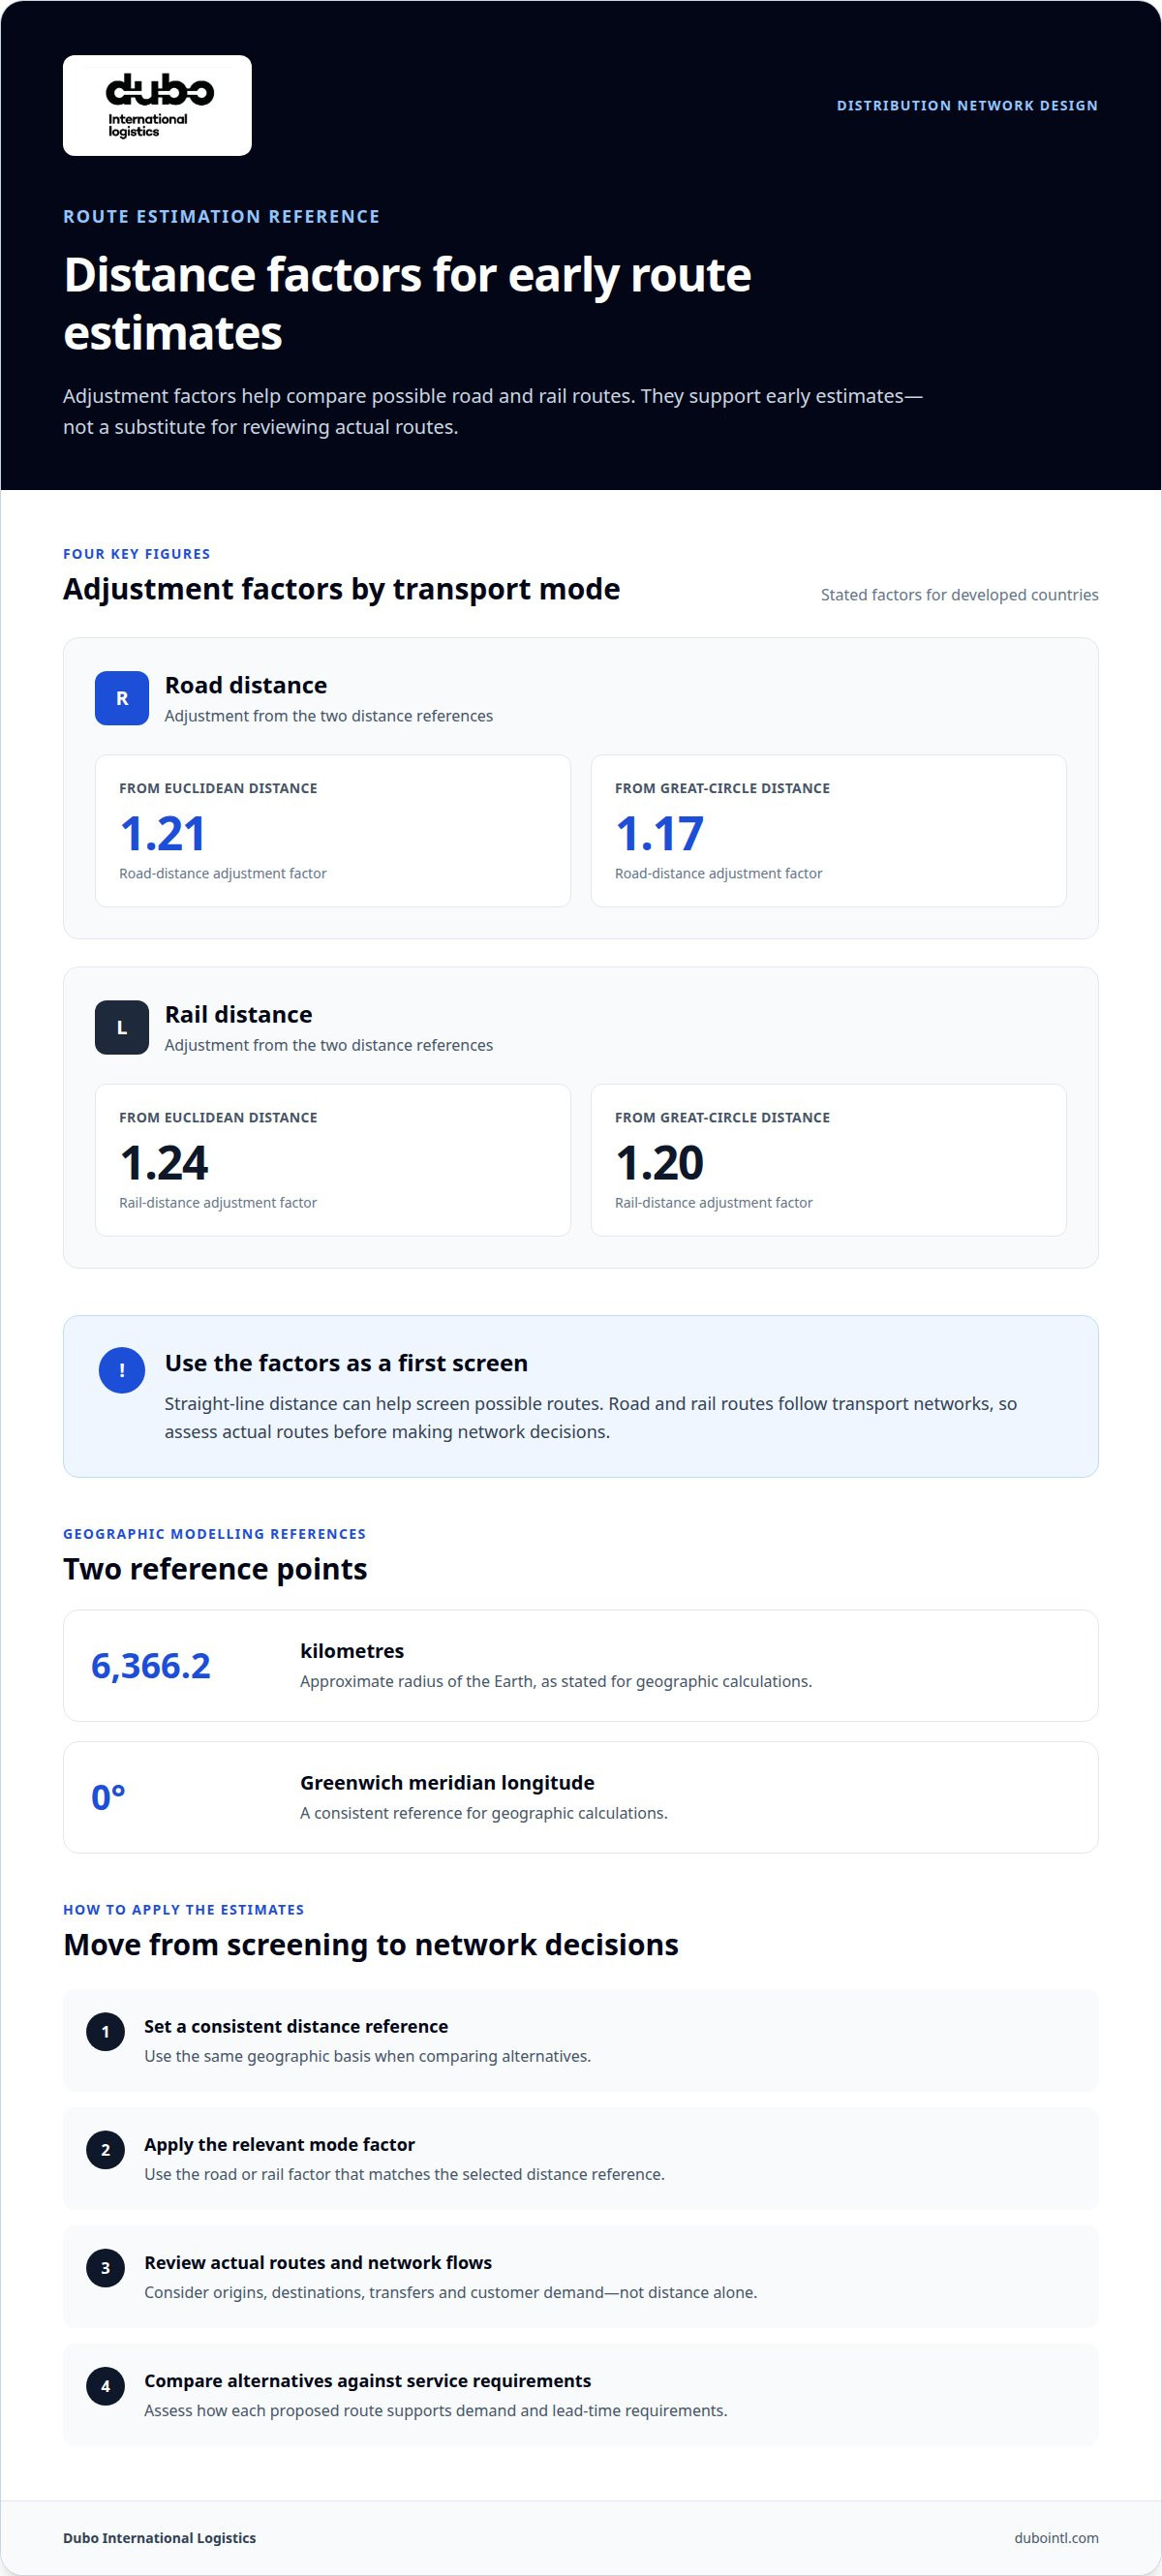
Distance estimates also affect route comparisons. Straight-line distance can help screen possible routes, but road and rail routes follow transport networks. For developed countries, the stated road-distance adjustment factor from Euclidean distance is 1.21. The stated road-distance adjustment factor from great-circle distance is 1.17. For rail, the stated adjustment factors are 1.24 from Euclidean distance and 1.20 from great-circle distance. These factors support early estimates, not a substitute for assessing actual routes.
Geographic calculations need a consistent reference. The earth's radius is approximately 6366.2 kilometers, and the Greenwich meridian has a longitude of zero. Such values can inform distance modelling, while Canadian shipment patterns determine which routes merit closer review. A sound design connects the analysis to decisions: where goods enter, how they move, and which routes best support customer demand and corporate strategy.
Geographic comparisons should be part of a broader review of network performance. A logistics network study uses collected network data to assess efficiency and goods flow. This gives decision-makers a basis for comparing alternatives instead of relying on distance alone.
The design process can combine data analysis with stakeholder interviews to understand current challenges and corporate strategy. It can assess how shipment routes and transfer points should be organized. The goal is a network aligned with business strategy and customer requirements for demand and lead times.
Transportation and inventory optimization
In Canada, professionals compare transportation modes by route, shipment requirements, speed and reliability. Highway, rail, intermodal and air options suit different operating needs, so the strongest choice depends on the complete movement.
Transportation mode, speed and reliability
Analysts assess each mode against shipment size, delivery window, route access and transfer requirements. Air can suit urgent freight, while rail can move suitable volumes over long distances. Highway transport offers direct connections, and intermodal combines modes along a route. These are planning considerations, not fixed rankings: transfer or schedule constraints can change the outcome.
For Canadian movements, the comparison should reflect the actual origin, destination and service requirement. Professionals review how each mode connects to pickup and delivery points, whether transfers add handling, and how schedules align with demand. They also consider pressures on transportation networks, including congestion and competition for capacity. A mode that looks suitable on a map may not meet a shipment’s timing or handling requirements.
Inventory optimization
Inventory analysis links stock levels with demand, replenishment timing and service needs. A model can test how changes in transportation frequency affect inventory availability. Simulation software tailored to an organization’s needs can examine these interactions, helping teams compare scenarios instead of judging each decision in isolation.
A product with uneven demand may need a different replenishment approach from a steady-moving item. Analysts examine product and order patterns to identify where inventory placement or movement creates friction.
Supply-chain modelling uses decision variables to optimize one or more performance measures. Professionals define the choices to test, such as transportation schedules, inventory policies or facility assignments, then assess how each option affects the model’s objectives. The result is a structured comparison, not a presumption about the best mode or stock level.
- Map the movement: connect shipment origins, destinations, transfers and delivery requirements.
- Test operating choices: compare schedules and inventory policies in relevant scenarios.
- Review fleet needs: assess fleet size, maintenance and schedule regularity where private fleets are used.
- Plan equipment positioning: account for repositioning empty containers or railcars where networks require them.
Equipment availability also shapes service reliability. In complex networks, empty containers or railcars may need repositioning before they are available for loading. Private-fleet operators also consider fleet size and schedule regularity. A logistics consulting review can help connect these operating decisions to a coordinated transport plan.
Logistics network optimization can use simulation software tailored to an organization’s needs to assess transportation and inventory management. Highway, rail, intermodal and air transport are part of broader networks where carriers both compete and cooperate.
When a shipper uses its own fleet, fleet size can create an incentive to keep transportation schedules regular. Logistics and supply-chain fleets need appropriate sizing and maintenance.
Business environment and operational concepts
Network design starts with the organization’s operating environment, not just a transport map. Analysts define what the supply chain must deliver before shaping its operating concept.
A supply chain integrates production planning and inventory control with distribution and logistics. At a Canadian manufacturer, a production change can alter inbound material needs, dispatch schedules and delivery commitments. A useful assessment traces these connections rather than treating transportation as a stand-alone function. It identifies the business purpose, customer requirements and operating conditions the network must support.
Conditions can shift around a network designed for stable, lean operations or Just-in-Time systems. Demand changes, capacity constraints and new service expectations may challenge customer performance, safety and security. A production plan that relies on frequent deliveries, for example, has different continuity needs from one built around less frequent replenishment. The design team should establish which assumptions still reflect the organization’s current environment.
Next, the team develops operating concepts and technical requirements. The concept explains how goods, people and information should move through the system. Technical requirements translate that approach into needs for transportation connections, equipment, information flows and operating skills. For a cross-border supply chain, the concept should also account for handoffs and coordination along the corridor.
Canadian regulations can affect cargo handling and transportation planning. Dangerous goods movements must account for the Règlement sur le transport des marchandises dangereuses, and operating plans must consider applicable requirements for drivers’ hours of service. Cargo characteristics, route and mode shape which requirements apply to a movement.
Complex operating concepts cover more than freight movement. They may involve provisioning, maintenance, people, skills, information flows and financial flows. A design that omits maintenance, for instance, may overlook equipment readiness. Likewise, excluding information handoffs can leave teams without the operational details needed to coordinate a shipment.
Analysts can structure the work as a sequence of decisions:
- Define the business environment: establish customer needs, operating pressures and strategic objectives.
- Describe the operating concept: map how products, people and information support the intended service.
- Set technical requirements: identify equipment, transport, skills and information needs.
- Evaluate the system: test whether the proposed design supports performance, safety and continuity.
Sector context matters, too. Retail, healthcare, energy, telecommunications and the military all use logistics systems, but their operating requirements differ. A healthcare network, for example, may depend on reliable coordination of sensitive supplies, while an energy project may centre on large equipment movements. The design process must reflect the actual business environment, not assume one operating concept suits every sector.
Clear operating concepts give technical decisions a purpose. They connect network choices to production, customer service and organizational priorities, helping teams assess whether the system can support those needs as conditions change.
Complex logistics system design and evaluation
A complex logistics system connects operating decisions, resources and information flows. Professionals assess resilience by mapping dependencies and testing how disruptions affect continuity.
Operational requirements and service levels
This assessment connects service expectations with the resources and processes needed to meet them. Professionals examine delivery windows, equipment availability and handoffs across the system. They compare requirements with operating arrangements, then identify processes that may constrain service. For example, a transfer point with limited handling capacity could affect the timing of connected activities. Reviewing that dependency helps teams understand the implications before changing the design.
Analysts also test assumptions about how operating areas influence system performance. Scenario reviews can show whether a proposed configuration supports the organization’s intended service or whether revised boundaries better reflect actual shipment flows.
Data and software for logistics design
Analysis draws on operational, people, skills, information and financial flows, alongside provisioning, operations and maintenance requirements. Supply-chain modelling uses decision variables to optimize one or more performance measures. Tailored simulation software can test how these variables interact, helping professionals compare scenarios for a specific organization rather than rely on a generic model.
For example, a simulation can examine how a maintenance constraint affects equipment availability and planned operations. Analysts define the measures to evaluate, then interpret results against business requirements. Data quality matters: incomplete or inconsistent inputs can distort comparisons between scenarios.
Post-implementation performance measurement
After implementation, companies can compare actual operations with the design’s performance measures and service commitments. Measures may include delivery-window performance, equipment availability, continuity of information handoffs and completion of planned activities. Reviewing these indicators together helps teams determine whether an issue stems from one process or a wider system dependency.
Teams can also compare operating results with the planning baseline. If a new transfer process creates delays, for instance, performance reviews can trace the effects across connected operations. Regular reviews give decision-makers evidence to refine schedules, processes or system assumptions as conditions change.
Evaluation should test resilience as well as expected performance. Scenario reviews can examine how disruptions to people, skills, equipment or information affect the system’s ability to continue operating. Professionals document dependencies, assess alternative operating arrangements and identify where one interruption could affect several activities.
A structured evaluation links findings to decisions:
- Set measures: define the service and operational outcomes the system must support.
- Model scenarios: test assumptions and decision variables using suitable simulation software.
- Assess dependencies: trace how disruptions affect connected activities and information flows.
- Review actual results: compare post-implementation performance with the planned measures.
This process gives complex systems a practical basis for design decisions. It connects service expectations with operating resources and provides a method for assessing whether implementation performs as intended.
How do logistics professionals assess service levels?
Professionals assess whether a shipment’s service meets its requirements. They separate logistics activity by route, product, mode and customer requirement. This reveals whether the network performs consistently across shipment types instead of hiding variations in an overall average. For example, a time-sensitive machinery movement should be reviewed separately from routine replenishment freight.
The analysis begins with clear categories. Transportation, handling, inventory and facility activity each contribute to the operating picture. Analysts examine records for each movement and connect them to shipment characteristics and service commitments. This helps identify whether a process, route or requirement drives additional activity, without mistaking one-off exceptions for recurring patterns.
Service levels need equally precise definitions. Service level agreements (SLAs) describe commitments such as delivery windows or equipment availability. Professionals compare recorded shipment outcomes with the applicable commitment, then segment results by lane, mode or cargo type. If a route repeatedly misses its delivery window, the team can examine transfer points, schedules and capacity before proposing a change.
- Set the baseline: establish the period, shipment groups and operating records included in the review.
- Segment the results: separate routes, cargo types and service requirements to reveal meaningful differences.
- Compare commitments: assess actual delivery and equipment outcomes against the relevant SLA.
- Trace exceptions: connect delays or extra handling to the route and process where they occurred.
Professionals examine trade-offs rather than treating one measure as the whole answer. A mode that supports a tighter delivery window may require more coordination or capacity. Consolidating a movement may change handling and timing. The analysis considers how each choice affects both the shipment’s operating requirements and the broader service commitment.
Reliable comparisons depend on consistent records. Shipment dates, route details, handling events and service commitments must describe the same movement. Analysts reconcile operational records with shipment documentation and group comparable movements. For example, comparing similar machinery shipments along the same corridor can help distinguish a recurring transfer issue from cargo-specific handling needs.
Findings should lead to a decision. Professionals can identify which lane or process needs closer review, compare practical alternatives and explain each option’s service implications. Clear measures also support later reviews, helping teams assess whether a revised schedule or route performs as intended. The analysis is most useful when it connects shipment-level evidence to an operating decision.
For a structured review of route performance and service commitments, discuss your network requirements.
Dubo International Logistics
Dubo International Logistics helps organizations connect network decisions with practical freight operations. Its logistics consulting supports analysis of shipment requirements, service expectations and operating constraints, while freight forwarding and specialized transportation services address the movement of complex cargo.
Consider this support when a network review identifies coordination needs across routes, modes or cargo requirements. Oversized machinery or delicate equipment, for example, may call for specialized transport planning alongside broader freight movement. The right approach depends on the shipment and the network it must move through.
To discuss your logistics requirements, contact Dubo International Logistics.
Turn analysis into a practical next step
The next stage is turning findings into decisions that teams can carry forward. A useful plan identifies which changes matter first, who will coordinate them and what evidence will show whether they are working. This keeps the design connected to daily operations instead of leaving it as a model or report.
A disciplined approach to logistics analysis and design also gives decision-makers a reference point as business needs change. New customer requirements, shipment patterns or operating constraints can prompt a focused review, helping the network adapt without losing sight of its wider objectives.
If you’re ready to discuss your distribution network requirements, contact Dubo International Logistics. A clear conversation can help establish the right next step for your operation.
Frequently Asked Questions
What is logistics analysis and design?
It is the process of assessing how goods move through a business and shaping the network that supports those movements. For example, a Canadian importer might review how inbound shipments connect with production schedules and customer deliveries. The analysis identifies operating constraints and evaluates possible network arrangements. The design translates those findings into a coordinated approach that fits the organization’s service requirements and business priorities.
What are the main steps professionals take in logistics network design?
Professionals typically define business objectives, gather operational information, assess the current network, develop alternatives and evaluate them against service and operating requirements. They then recommend an approach and plan its implementation. If a manufacturer adds a product line, for example, analysts can assess how its shipment profile affects existing routes and facility roles before recommending a network change.
How do logistics professionals assess warehouse locations and determine facility capacity?
They compare candidate locations against demand patterns, transportation connections, delivery requirements and each facility’s role in the network. Capacity planning considers the volume and type of goods handled, expected operating flows and the space needed. A hub receiving bulky equipment, for example, may need a different layout from one handling smaller, frequent shipments. The assessment tests whether each site can support its assigned role.
