

Strong freight forwarder performance involves more than a smooth delivery. Knowing how to measure freight forwarder performance means assessing accuracy, delivery timing, visibility, and wait times together. These measures show whether shipments support your operating plans and where recurring issues need attention.
Delays, incomplete updates, and time spent waiting can disrupt shipment planning. A practical review applies consistent measures across shipments, helping you spot patterns rather than draw conclusions from a single delivery. This guide explains how to assess these indicators and use them to inform logistics decisions across Canada.
Key Takeaways
- Compare freight charges with shipment weight or volume, and assess them alongside service quality rather than in isolation.
- Track shipment and order accuracy by recording errors in quantities, documents, and delivery destinations.
- Review transit time and on-time delivery regularly to identify patterns and address recurring delays.
- Measure visibility by how clearly shipment status, milestones, and exceptions are communicated.
- Record loading and unloading delays consistently so average wait time can highlight process bottlenecks.
1. Freight cost per tonne shipped
What KPIs measure freight forwarder performance? Track on-time pickup and delivery, transit time, shipment accuracy, visibility, wait time, and claims. For heavier freight, record tonnes shipped alongside these measures. This lets you compare outcomes across shipments of different weights without treating a larger load as an operational failure.
Keep weight records consistent. Use the same unit and shipment scope in each reporting period, and distinguish gross shipment weight from the weight used in operational records. For example, compare shipments on the same route and mode, then review delays or handling exceptions by weight category. This can show whether particular loads need different planning.
Shipment accuracy should cover quantity, documentation, and destination. Record each error against the affected shipment, then group results by error type. If a document mismatch repeatedly delays heavier loads, the pattern may point to a handoff or data-entry issue. Separate error counts make the trend easier to identify.
What is a good freight forwarder claims rate and cargo damage rate? No single target applies to every cargo type and route. Track claims per shipment and record damage incidents separately, including their cause and severity. A recurring issue involving delicate equipment deserves attention even when the overall claim count remains low.
For a useful scorecard, include shipment weight, route, mode, planned milestones, actual milestones, accuracy, and exceptions. Keep definitions stable from one review to the next. This gives teams a consistent basis for identifying operational differences between comparable shipments.
How should Canadian businesses evaluate customs clearance performance? Review document completeness, handoff timing, status communication, and delays linked to missing or corrected information. Compare shipment records to identify recurring documentation problems. Clear timestamps help distinguish preparation delays from delays elsewhere in the shipment.
How often should businesses review freight forwarder performance and scorecards? Review core measures weekly or monthly, then examine patterns over three to six months. Regular reviews can reveal emerging issues, while a longer view helps distinguish recurring problems from isolated exceptions.
A practical way to understand how to measure freight forwarder performance is to connect each metric to an operational question. Ask whether heavier shipments miss more milestones, whether particular routes have recurring document errors, or whether damage clusters around specific handling steps. Each question directs attention to records that can support useful follow-up.
When deciding how to measure freight forwarder performance, document the reporting period, shipment count, data source, and metric definition. Include cancelled or rescheduled movements consistently, and note exceptional circumstances separately. This makes comparisons clearer and gives review discussions a reliable starting point.
2. Shipment, order and inventory accuracy
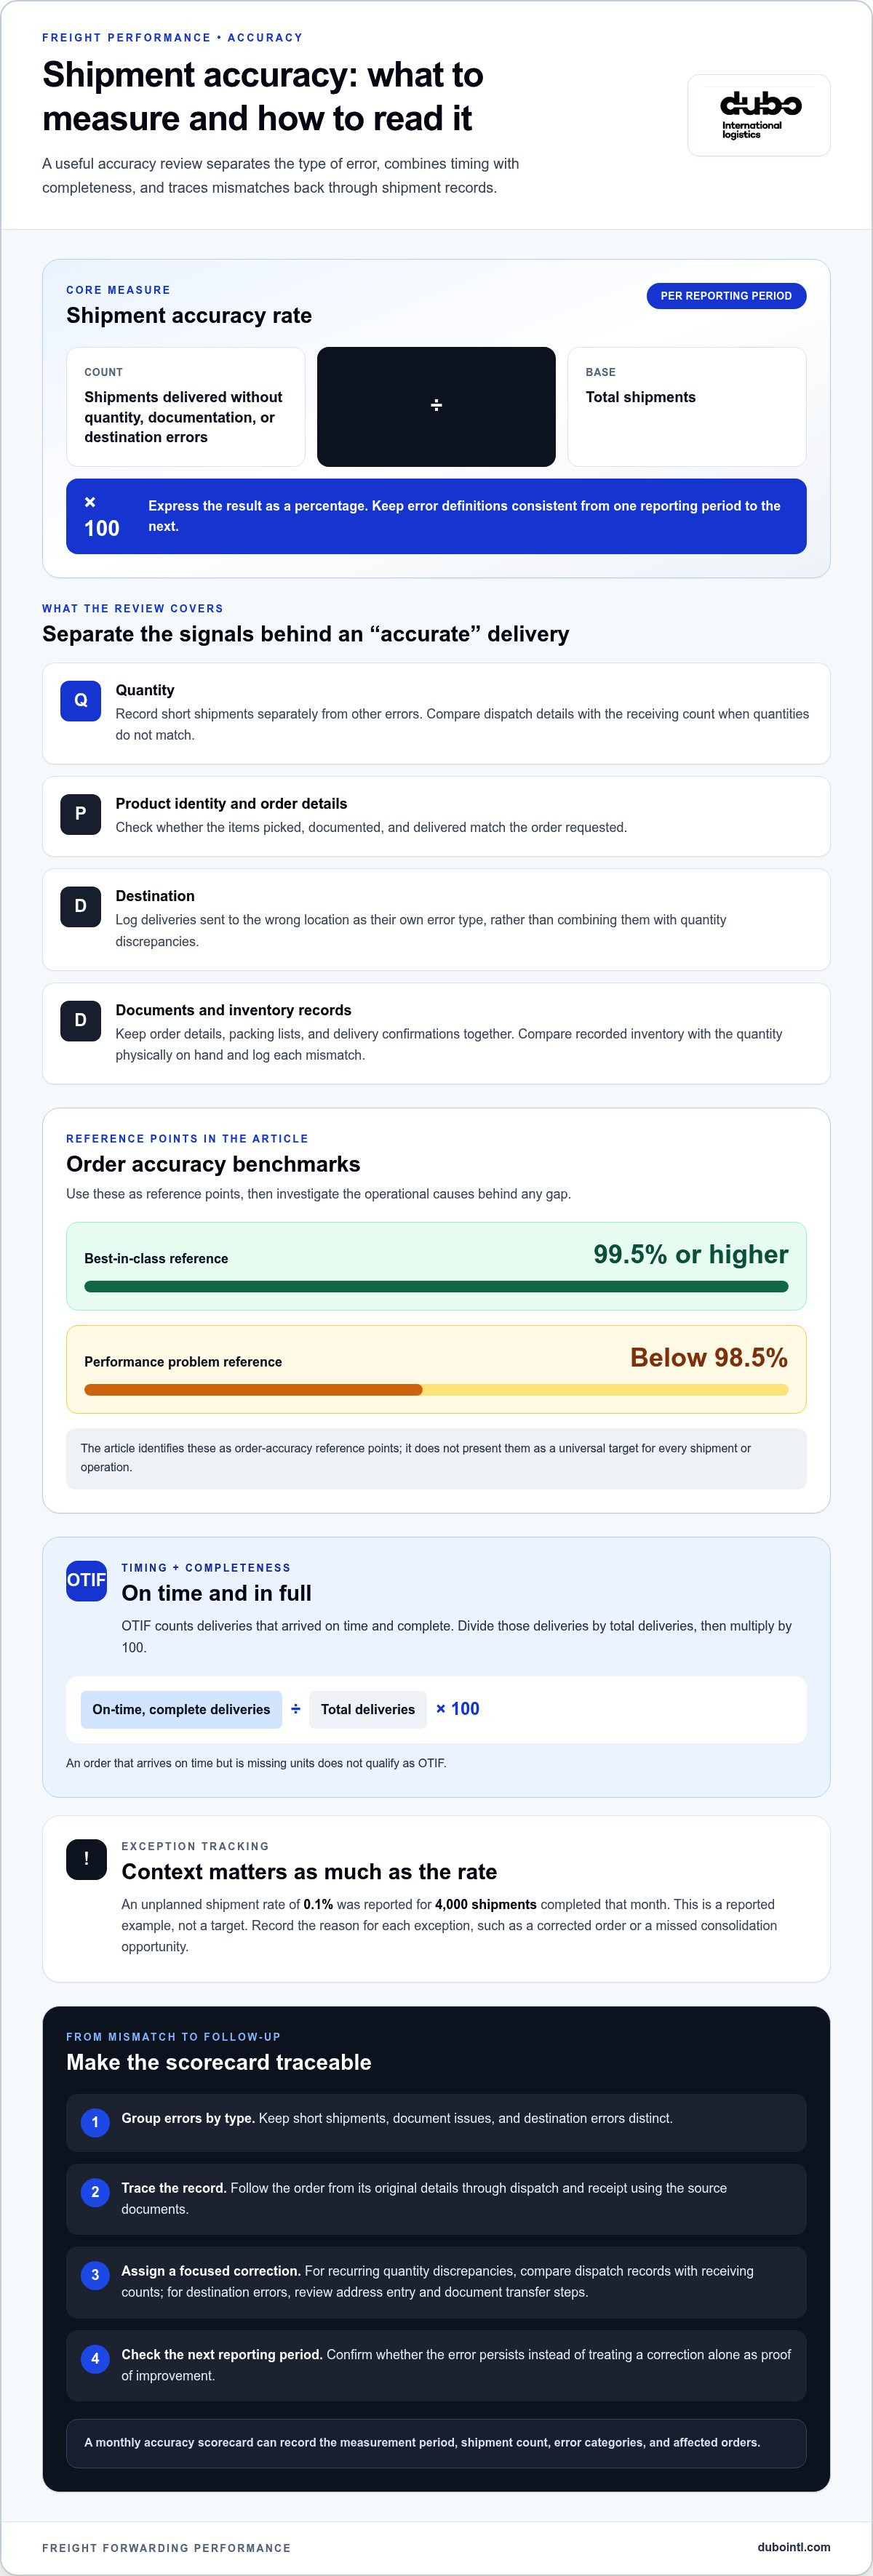
Accuracy shows whether the delivered shipment matches the one planned. Measure quantity, product identity, destination, and document correctness. A shipment can arrive on time yet still fail its intended purpose if the wrong items arrive or records contain errors.
Start with shipment accuracy: divide shipments delivered without quantity, documentation, or destination errors by total shipments, then multiply by 100. Use the same error definitions for every reporting period. For example, record a short shipment separately from a delivery sent to the wrong location. This helps identify the type of failure, not just its frequency.
Order accuracy looks at whether each order was picked, documented, and delivered as requested. A rate of 99.5% or higher is identified as best-in-class, while a rate below 98.5% indicates a costly performance problem. Treat these figures as reference points, then examine the operational causes behind any gap.
Use OTIF, or on time and in full, to combine timing and quantity. Calculate deliveries that arrived on time and complete, divide by total deliveries, and multiply by 100. Because OTIF includes both conditions, it can reveal failures that a delivery-date measure alone would miss. An order arriving on time with missing units does not qualify as OTIF.
Inventory accuracy adds a check between shipment records and the stock physically available. Compare the recorded quantity for an item with the count on hand, then log each mismatch. For instance, if the system records a full case but the receiving count shows fewer units, investigate the handoff, labelling, and receiving records. Repeat the process across products and locations.
Separate planned orders from unplanned shipments. An unplanned shipment rate of 0.1% was reported for 4,000 shipments completed that month. Track the reason for each exception, such as a corrected order or a missed consolidation opportunity. A low rate is useful only when teams also understand why exceptions occurred.
Build a monthly accuracy scorecard with the measurement period, shipment count, error categories, and affected orders. Keep source records, such as order details, packing lists, and delivery confirmations, together. If a mismatch appears, trace it from the original order through dispatch and receipt. This sequence helps locate where the information or cargo diverged.
Accuracy measures are more useful when teams assign corrective actions to specific error patterns. If quantity discrepancies recur, compare dispatch records with receiving counts. If destination errors recur, review address entry and document transfer steps. Monitor the next reporting period to see whether the error persists, rather than treating a correction as proof of improvement.
3. Why Are Logistics KPIs and Metrics Important?
Logistics KPIs turn shipment outcomes into information teams can act on. For transit time, measure the elapsed time from departure at origin to arrival at destination. For on-time delivery, compare the actual arrival date with the promised date. These measures reveal different issues: a shipment can meet its delivery window while taking longer than comparable shipments.
Track transit time by route, transport mode, and shipment type. A five-day, 2,000-mile journey equals 0.0025 days per mile. This ratio offers context for comparing routes, but it cannot explain delays by itself. Review departure and arrival timestamps alongside the distance and operating conditions recorded for each shipment.
On-time delivery rate measures shipments delivered on or before the promised date. Divide on-time deliveries by total deliveries, then multiply by 100. One example reports that 83% of units arrived on time. A separate example reports 78.3% of orders shipped on time. Keep final delivery and shipment dispatch as distinct measures.
Pickup performance gives another useful checkpoint. One monthly example reports that 93.5% of shipments were picked up on time. Compare scheduled and actual pickup timestamps, then group late collections by route, carrier, or pickup location. This helps show whether delays begin before transit or develop later in the movement.
Do not combine on-time delivery and on-time pickup into one score. A late pickup can reduce the time available for transit, while a timely pickup does not guarantee arrival by the promised date. Reviewing both milestones clarifies where the shipment process fell behind and supports focused discussions about corrective action.
Review core KPIs weekly or monthly, depending on shipment volume and operational needs. Weekly reviews can surface immediate disruptions, while monthly scorecards reveal broader performance changes. Examine patterns over three to six months before treating a single result as a lasting trend. Compare equivalent routes and service requirements to avoid misleading conclusions.
A useful scorecard pairs each percentage with its shipment count and reporting period. For example, a delivery rate should show both the share delivered on time and the total number of deliveries measured. A percentage without volume can obscure the scale of missed commitments. Keep promised dates consistent, and record approved changes separately from missed delivery windows.
Set review steps before examining the results. First, confirm timestamp and promised-date definitions. Next, compare pickup, dispatch, transit, and final delivery measures. Then identify recurring delays by route or milestone and assign a follow-up action. This method turns logistics KPIs into operational decisions rather than isolated figures on a monthly report.
4. Transparency and visibility
Shipment visibility means knowing where cargo stands and which milestone comes next. Track booking, pickup, departure, transfer, and delivery. For each event, record its planned time, actual time, status, and update timestamp. These details help distinguish a shipment delay from a communication gap and show where teams need clearer information.
Make updates useful for decisions. A status such as “in transit” says little without a recent event or the next expected milestone. Record the shipment reference, location, event time, and any exception. For example, if a connection is missed, note when the status changed and which handoff was affected. Consistent entries make later reviews more precise.
To measure freight invoice accuracy, divide invoices matching documented shipment terms by invoices reviewed, then multiply by 100. Assess accessorial charge transparency by checking whether each listed service has a clear description and supporting record. Log the service, shipment reference, explanation, and approval status for each entry.
Use a repeatable invoice review process. Match each invoice to its shipment reference and agreed terms. Check shipment details, listed services, and supporting documentation. Record discrepancies and whether they were corrected. For example, flag an unexplained handling entry for clarification before approving the invoice.
Keep accessorial entries separate from the core transportation service. Handling, documentation, and other additional services should each have a clear label and a related shipment record. Separate categories make it easier to understand what was performed and whether the documentation supports the entry. Consistent labels also help identify recurring discrepancies.
Bring visibility and invoice records together in a shipment-level review. Pair milestone updates with the final invoice and supporting documents. Then compare the planned route and service with the recorded movement. If an exception and an additional service entry appear together, review their timing and documentation before deciding whether the records align.
Review exceptions consistently across shipments. Group missed updates, invoice discrepancies, and unclear accessorial entries by type, route, or handoff. Use the resulting record to assign follow-up actions. A monthly review can reveal whether the same visibility or documentation issue continues and whether corrective steps have improved the record.
Keep a clear audit trail for each shipment. Store status messages, milestone timestamps, invoice versions, and supporting service records together under one reference. This gives operations and finance teams a shared record to consult when questions arise. It also helps ensure future reviews use comparable information rather than scattered notes.
5. Average wait time
Average wait time measures how long a carrier waits for loading or unloading. Record arrival and release times at each pickup and delivery point. Subtract the arrival time from the release time to calculate each wait. Then add those durations and divide by the number of completed stops measured.
Keep loading and unloading waits separate. A long loading delay may point to cargo readiness or dock coordination. An unloading delay may involve a different location or receiving process. Combining the two can hide where time accumulates. Separate records help teams identify which handoff needs attention.
Use consistent start and end points. For example, start when a carrier checks in and stop when loading begins. At delivery, record check-in and release after unloading. Apply these definitions to every shipment and reporting period. Otherwise, figures from different locations may not be fairly comparable.
A reported dock-to-stock example calculates an average of 0.67 hours per shipment. A receiving-cycle example can illustrate how recorded time can be averaged across shipments. The calculation is 12 divided by 18. This example shows how total recorded wait can become a per-shipment measure.
Review the average alongside the underlying shipment records. A single extended wait can raise the mean, even when other stops are quick. Keep individual durations available, then group them by location, activity, route, or shipment type. This helps distinguish a recurring bottleneck from an isolated disruption.
Record the reason for each delay when known. For example, note whether freight was not ready, paperwork needed correction, or receiving began late. Avoid assigning a cause based only on elapsed time. A timestamp shows when a delay occurred; an incident note helps explain its operational context.
Compare wait-time patterns with pickup and delivery milestones. If a shipment waits before departure, examine the loading handoff. If the delay occurs at the destination, review the receiving process. Record any corrective action alongside the affected shipments, then assess subsequent shipments using the same definitions.
Include wait time in the same shipment scorecard as transit and delivery measures. Consistent records make it easier to see how time at facilities affects the movement plan. To connect wait-time tracking with time-sensitive freight planning, plan a time-sensitive freight movement around clear pickup and delivery milestones.
Other freight forwarding measures can distinguish facility waits from related delays. Customs clearance time measures the average time shipments take to clear customs in origin and destination countries. Document processing time measures the time taken to prepare and share key shipping documents, including invoices, HBL/MBL, packing lists, and certificates. On-time delivery rate is the percentage of shipments delivered on or before the promised date; one carrier example in the post has a 95% on-time delivery rate. A carrier performance score can combine on-time delivery, communication, issue resolution, and billing accuracy.
Dubo International Logistics: Freight forwarding
Dubo International Logistics helps businesses coordinate freight forwarding across complex shipment requirements. When performance reviews reveal recurring handoff delays, documentation gaps, or specialized cargo needs, logistics consulting can help clarify processes and identify practical improvements. For oversized machinery, fragile equipment, or temperature-sensitive products, specialized transportation services can support planning around the cargo’s specific handling needs.
Bring shipment records, service expectations, and recurring issues into the discussion. A clear view of the route, cargo, and performance measures helps shape logistics coordination around your operational priorities. Dubo International Logistics provides freight forwarding and logistics consulting for shipments across Canada, the United States, and the broader North American market.
Contact Dubo International Logistics to discuss your freight forwarding needs, or visit dubointl.com.
Turn performance data into your next logistics decision
Make performance measures part of routine planning. Give each measure a clear owner, agree on how to record exceptions, and use review meetings to choose one operational change at a time. This keeps scorecards connected to decisions instead of turning them into reports that are filed and forgotten.
A practical way to understand how to measure freight forwarder performance is to connect each measure to a business priority, such as dependable production schedules or clearer shipment planning. Then decide what evidence would show that a process has improved, and revisit that evidence during future reviews. Consistent definitions make those conversations more focused and useful.
If you’re assessing shipment coordination or refining your performance approach, Dubo International Logistics can discuss your requirements. Contact Dubo International Logistics to explore a suitable next step for your freight needs. With a clear plan and informed decisions, your logistics reviews can support steady progress.
Frequently Asked Questions
Why Are Logistics KPIs and Metrics Important?
Logistics KPIs turn operational records into evidence for planning and corrective decisions. For example, a manufacturer facing repeated production interruptions can compare shipment exceptions with affected production schedules. This helps teams decide whether to adjust order timing, shipment plans, or communication processes. Choose measures that connect to business priorities, assign someone to review them, and record the action taken so future discussions focus on outcomes.
How to calculate on-time pickup and delivery rates for freight forwarders?
Divide shipments meeting the agreed pickup or delivery time by the eligible shipments measured, then multiply by 100. Calculate pickup and delivery separately, using each shipment’s scheduled milestone as the comparison point. Before calculating, define how to treat cancelled shipments, rescheduled appointments, and incomplete records. Apply those rules consistently across reporting periods, so a change in the rate reflects performance rather than a change in counting methods.
How to measure freight forwarding transit time and schedule reliability?
Measure transit time from the agreed departure event to the agreed arrival event, using consistent timestamps. Compare each actual arrival with the planned arrival to assess schedule reliability. For a shipment with several handoffs, retain milestone times for each leg rather than recording only the final arrival. This helps identify where the schedule changed and whether the variance arose before departure, during transit, or at a transfer point.
How to track freight forwarder shipment visibility and communication responsiveness?
Keep a shipment log showing each milestone, when its status was shared, and the communication channel used. For exceptions, record when the issue arose, when it was communicated, and when a useful next-step update arrived. For example, compare the update trail for a missed connection with the shipment timeline. This separates movement delays from communication gaps and gives teams evidence to improve escalation and update procedures.
How to compare freight forwarders on cost, service, and reliability?
Compare providers using shipments with similar routes, cargo requirements, and service expectations. Review the full quoted scope alongside delivery outcomes, accuracy, visibility, and exception handling. A lower quote may not represent the same service if required handling or shipment conditions differ. Use a scorecard that records each measure separately, then weight the criteria according to business priorities, such as protecting delicate cargo or meeting a production schedule.
What service-level agreements and benchmarks should freight forwarders meet?
Service level agreements (SLAs) should define the commitments relevant to the shipment, such as agreed milestones, update expectations, exception escalation, and performance reporting. Set benchmarks around the route, cargo needs, and operating plan instead of applying one target to every movement. Include how results are measured and reviewed. Clear definitions make it easier for both parties to identify missed commitments and agree on practical follow-up actions.

